Traffic Density Maps for a better understanding of maritime traffic
Today EMSA is proud to announce the release by EMODnet of our Traffic Density Maps which offer a simple and effective way of displaying ship movement patterns, thereby contributing to a better understanding of maritime traffic. With ships more ubiquitous than ever, it has become increasingly important to know where ships are sailing, what their routes are, and which ship types are navigating on which routes. EMSA’s Traffic Density Maps (TDM) make it possible to tell whether an area is characterised by high or low shipping traffic. This, in turn, enables the relevant authorities to make risk assessments, improve traffic planning and enhance overall ship safety.
The ‘engine’ of EMSA’s TDM is powered by Automatic Identification System (AIS) data received by EMSA from its data providers (member states from their coastal receivers and commercial and non-commercial providers of signals received from satellites). AIS data are essentially messages sent by ships’ on-board transponders transmitting information such as position, speed, ship type, etc. initially conceived to enhance maritime safety and security. EMSA receives near-real-time AIS messages in the framework of the vessel traffic monitoring and information system, SafeSeaNet.
EMSA has processed its AIS data, in such a way as to rebuild the track of each distinct ship from its recorded positions and to count how many routes are crossing each cell of an EU-wide grid during a given time period. This method can be implemented in all regions (coastal and open sea), using all the available ships’ position data and allows ship routes to be connected even within areas with a low coverage. The method, agreed with the member states, is available on EMSA’s website.
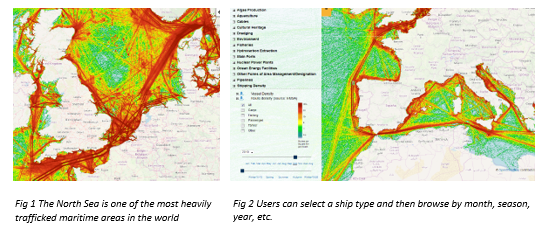
In an effort to make the most of existing EU initiatives, EMSA’s TDM are available to users on EMODnet Human Activities, the European Commission’s entry point to geographic information on the use of our oceans. This was possible thanks to an agreement signed between EMSA and DG MARE. Users can browse through months and years and see how traffic has changed. They can choose to view the entire traffic, or to focus only on their ship types of interest.
Claims on sea-space are increasing, especially with the growth of the offshore wind industry. These digital maps enable planners to identify the main traffic routes in order to ensure that the needs of all types of navigation – transport of goods, ferries, fishing, leisure – are taken into account as the blue economy develops.
So, please feel free to check out the maps on EMODnet Human Activities and share your thoughts.
-
Published20.12.2019
-
Updated20.12.2019